




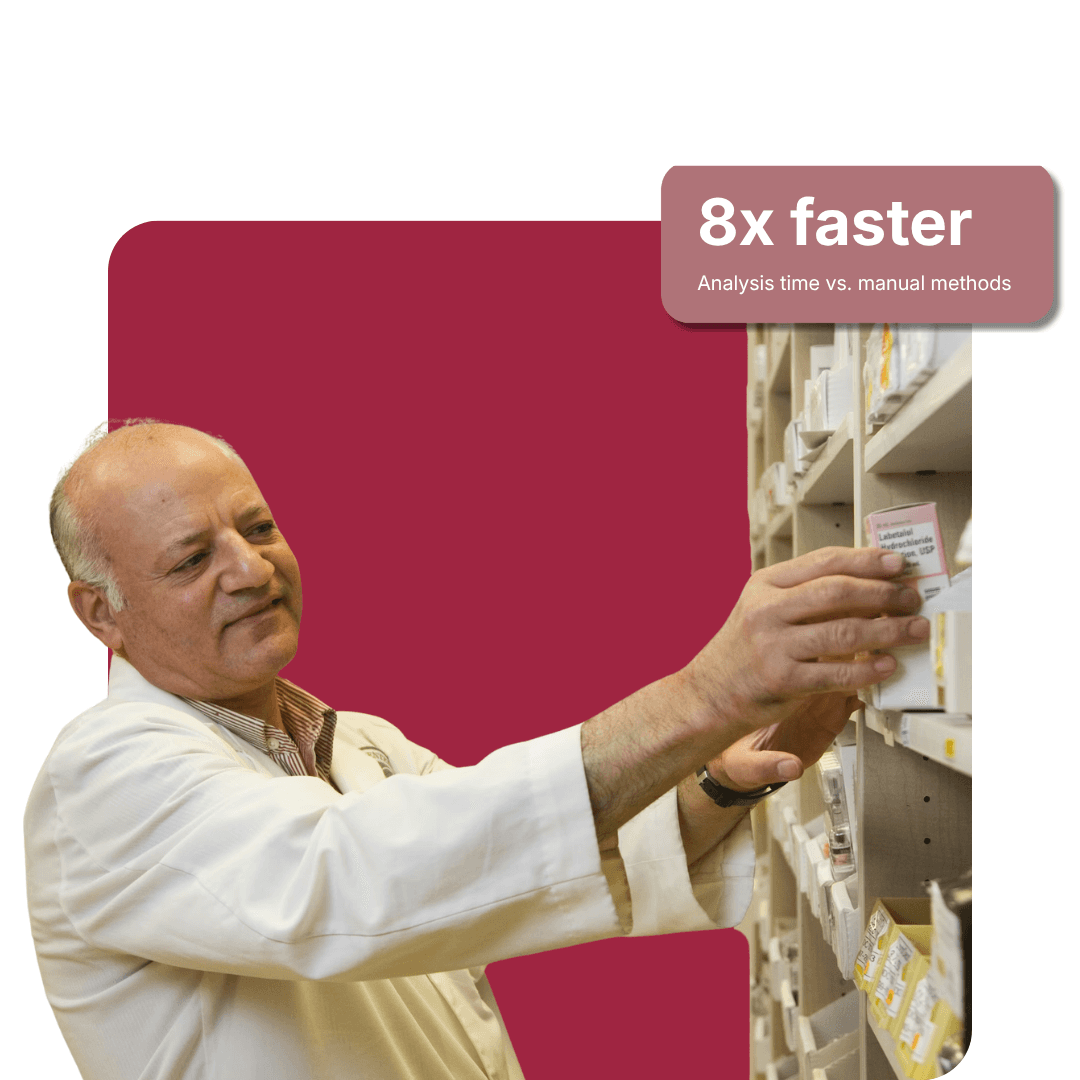
Global Healthcare Company
10x Faster Analysis
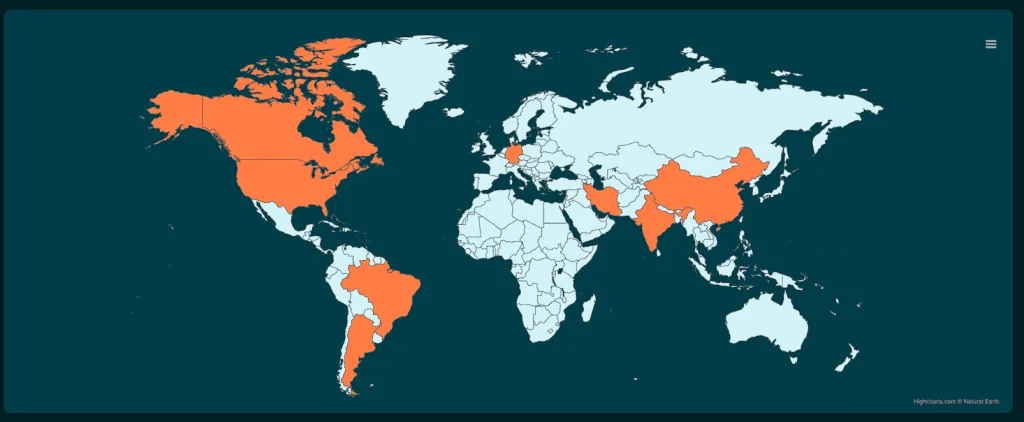
China and Germany import complexity analyzed in minutes, not a month.
8x Better Planning
Planning horizon extended from 3 weeks to 24 weeks.
+20% On-Time Delivery
Service level agreements improved by 25%.
Smarter Sourcing
Supplier selection optimized through an integrated supplier database.

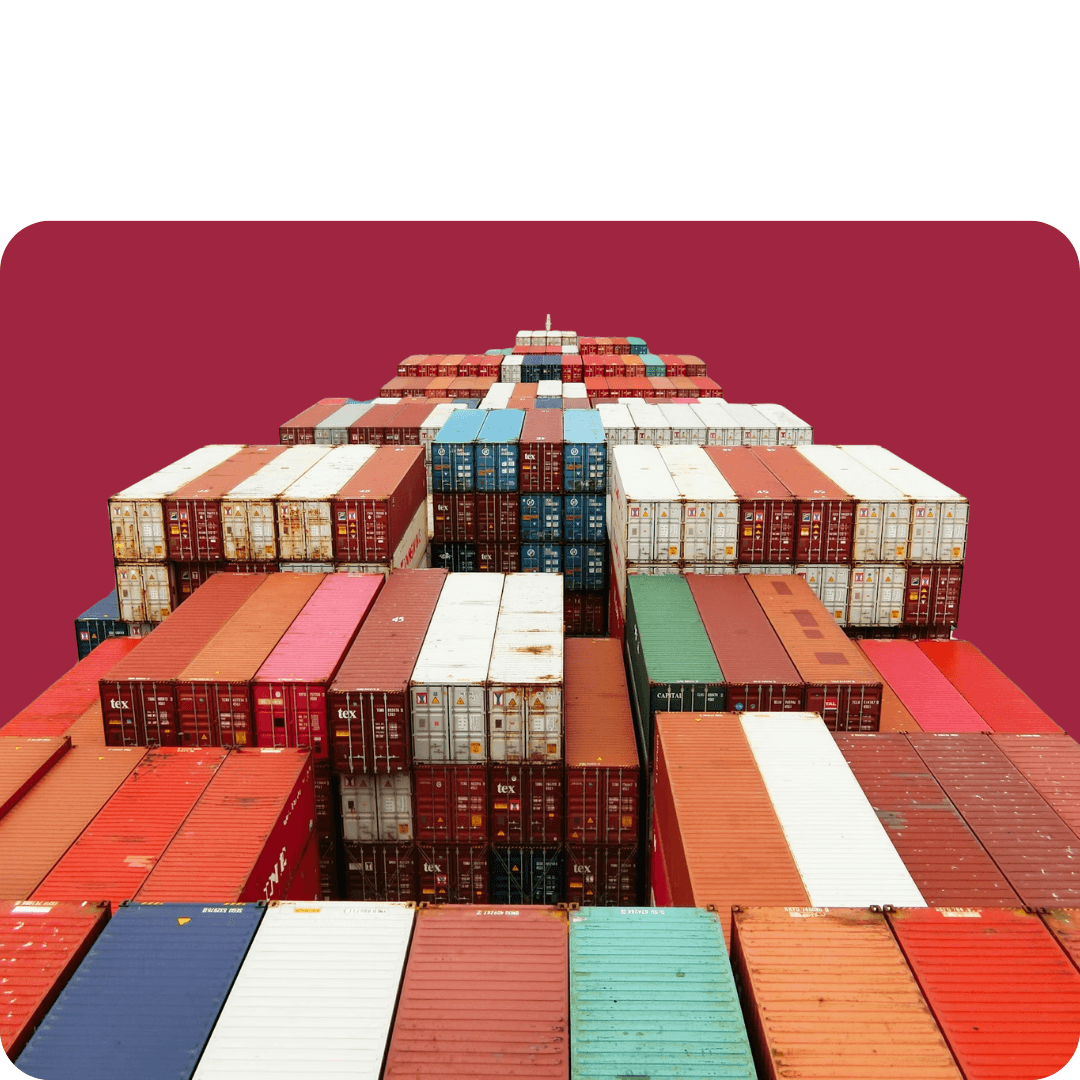
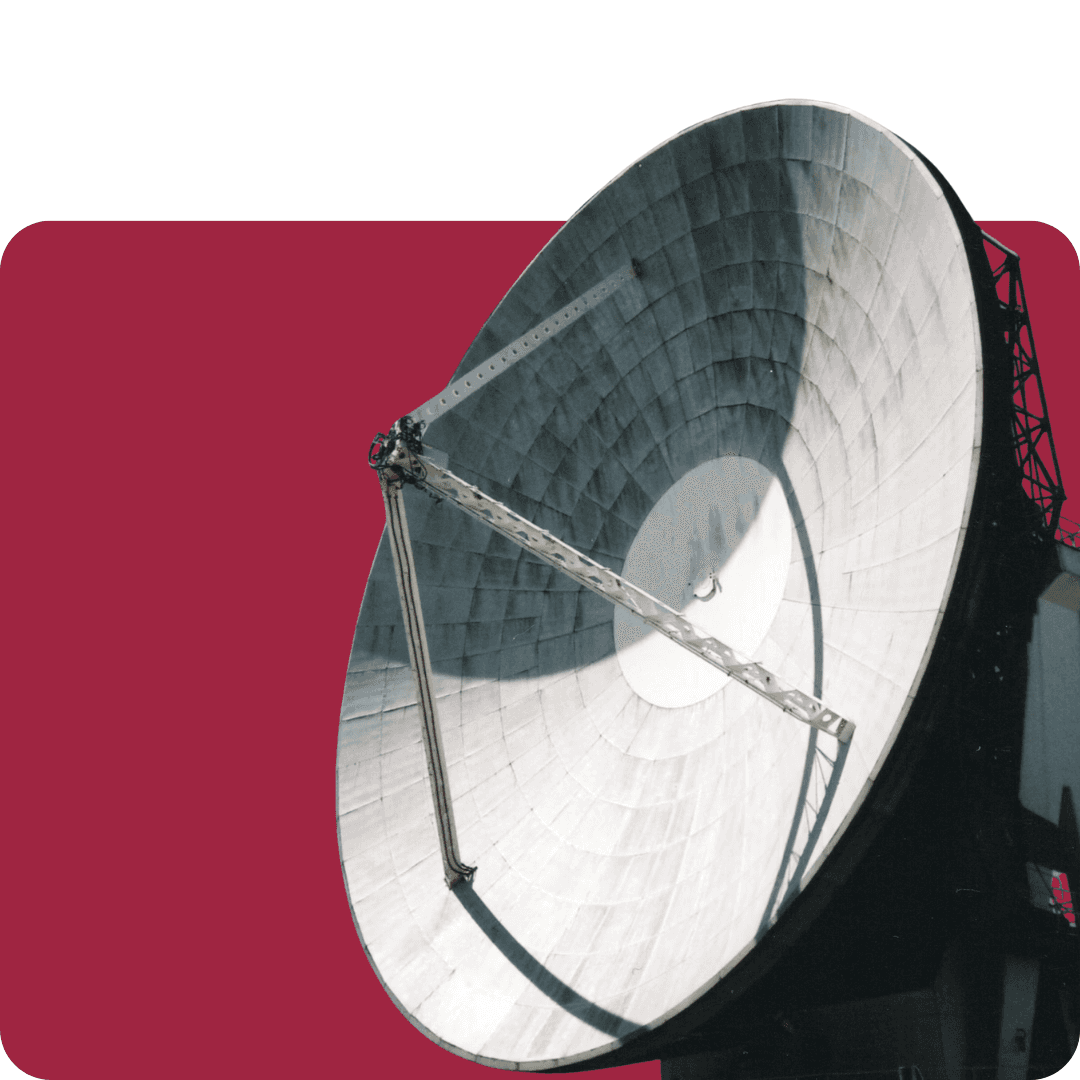
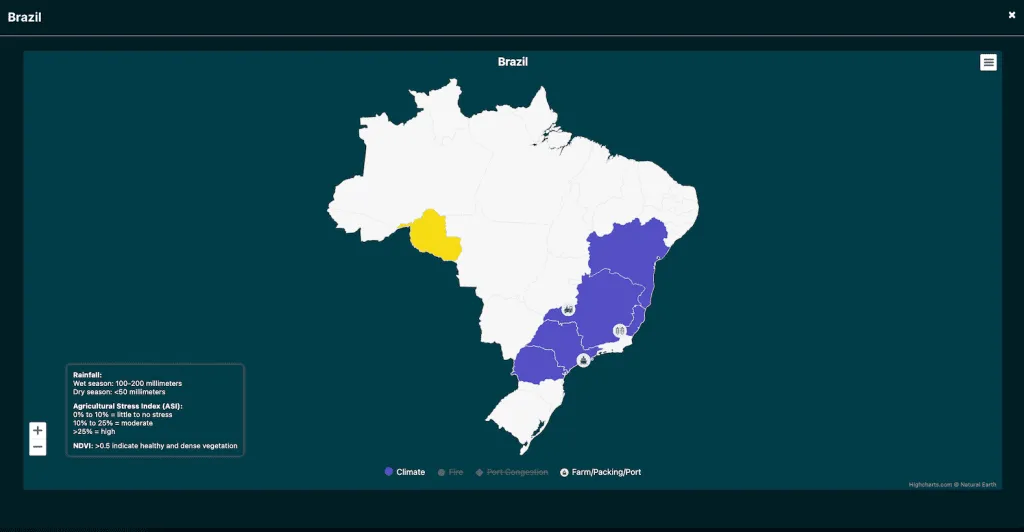
Importing coffee from Brazil
Satellite-Scale Data
Terabytes of satellite imagery and GIS data processed for sourcing.
Climate Intelligence
Plantations compared on rainfall, drought, and vegetation health.
Resilient Sourcing
Drought-risk suppliers swapped for higher-rainfall regions.
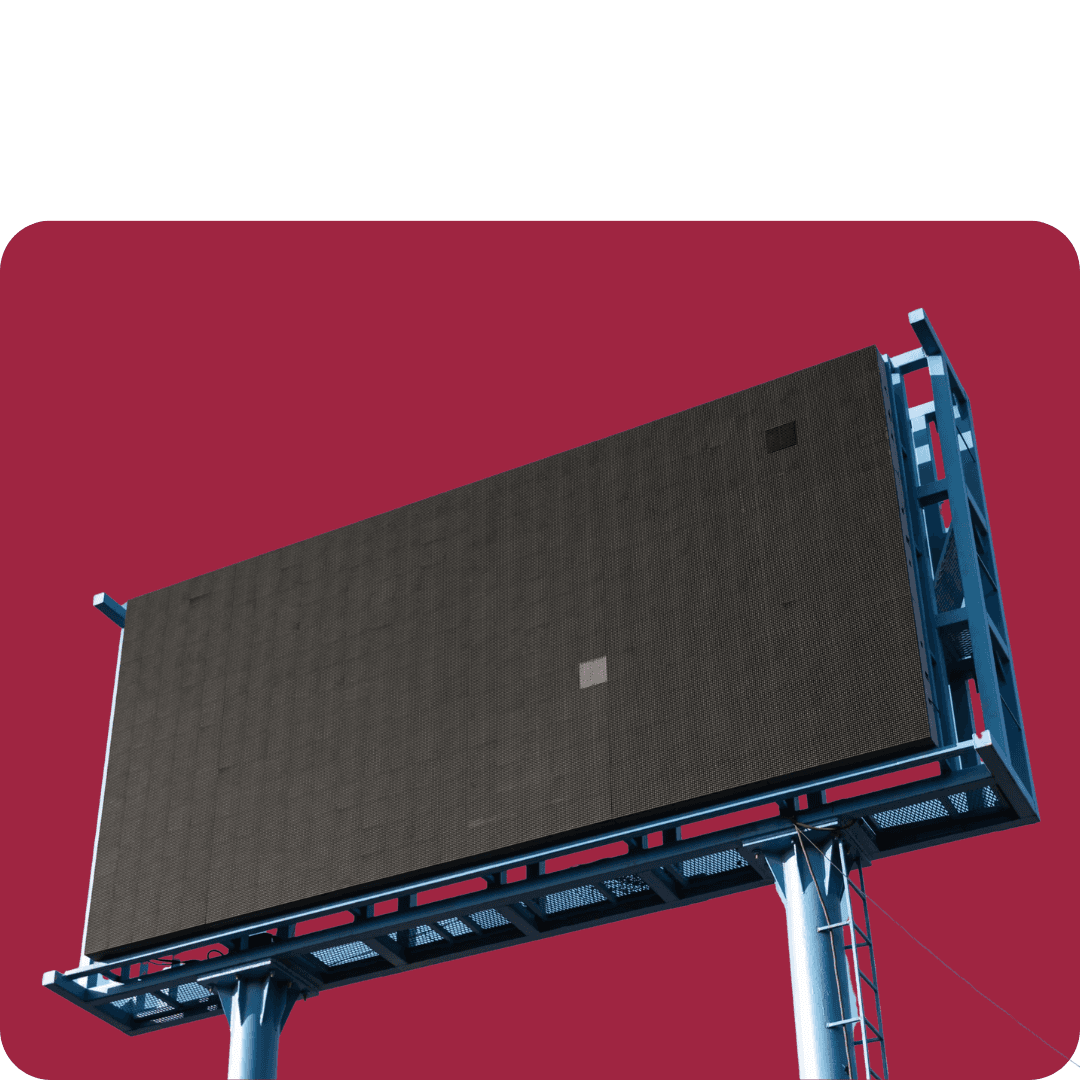
Marketing and media optimization
6B+ Data Points
US census and demographic data optimized billboard placement.
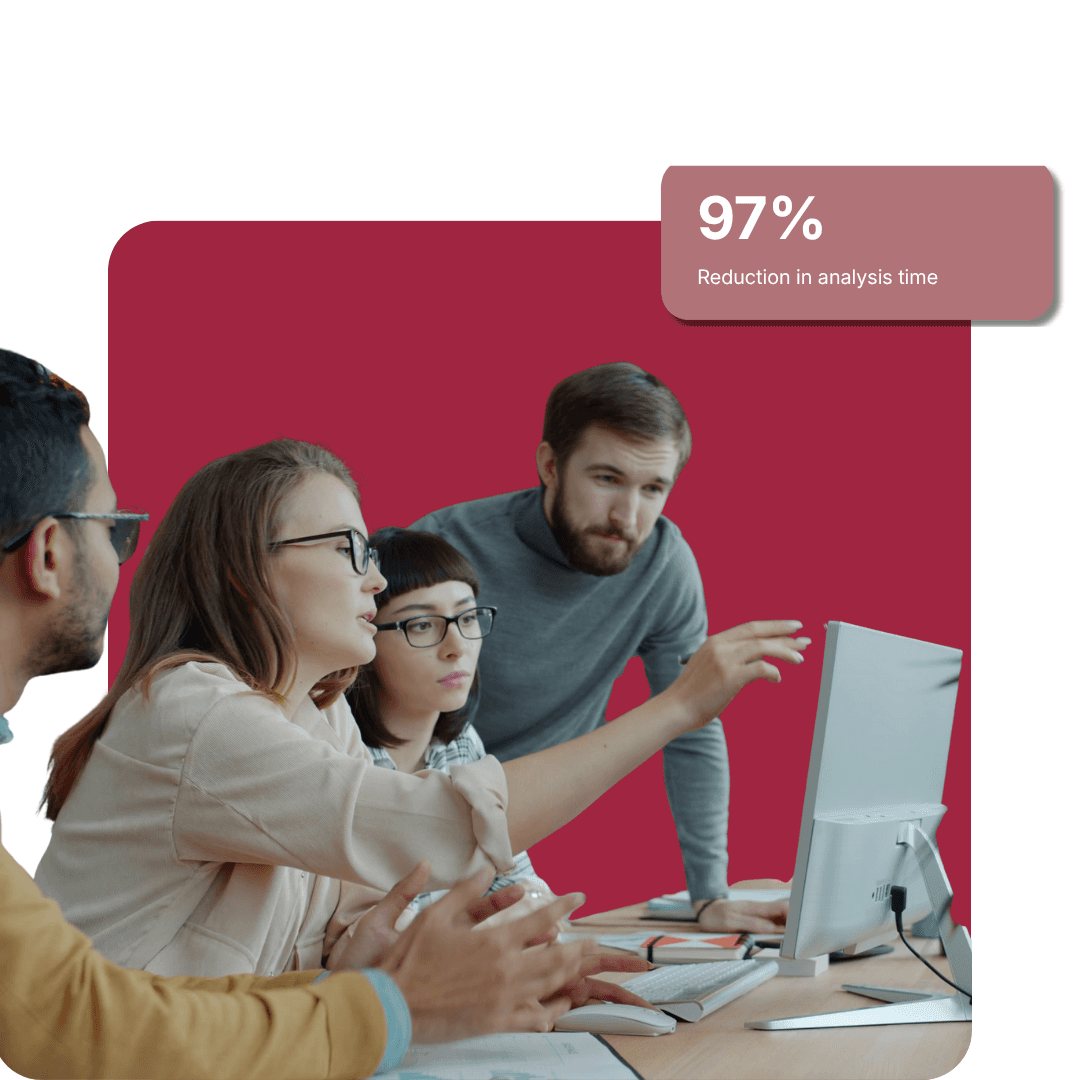
97% Faster Analysis
Delivered a durable competitive advantage.
Global Automotive Company
50%+ Fewer Forecast Errors
Real-Time Anomaly Detection
EDI and sales anomalies flagged instantly.
Earlier Market Signals
Shifts identified weeks ahead, linked to demand drivers.
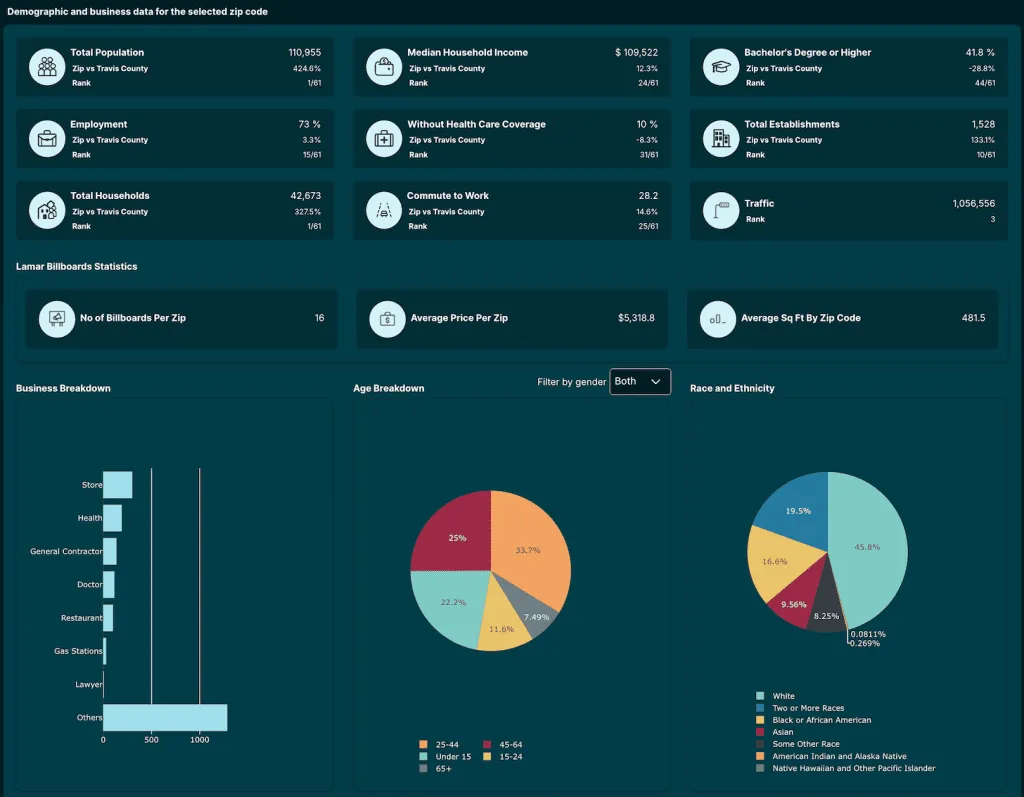
Leading Marketing and Advertising Company
97% Faster Insights
Connected Signals
Macro and demographic data linked directly to media planning.
Durable Advantage
Faster insight turned into sustained revenue growth.
Fortune 100 Healthcare Company
8x Longer Planning Horizon
+20% On-Time-In-Full
+25% Service Level
Outperformed top global consultancies.
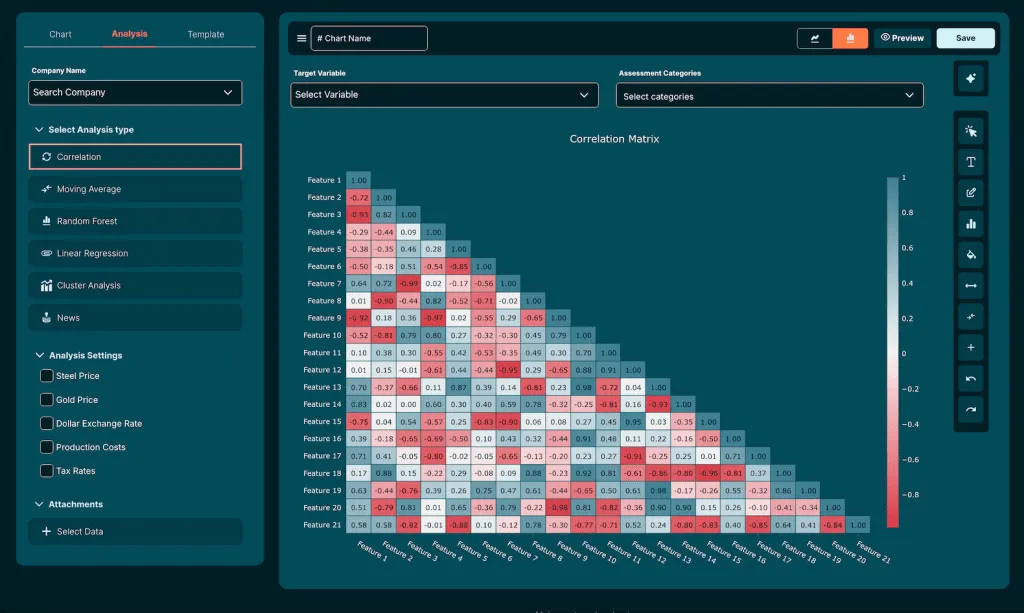
No-Code Platform
Business teams move without waiting on IT.
10B+ Global Signals
Integrated directly with internal enterprise data.
95% Faster Analysis
Than traditional methods.
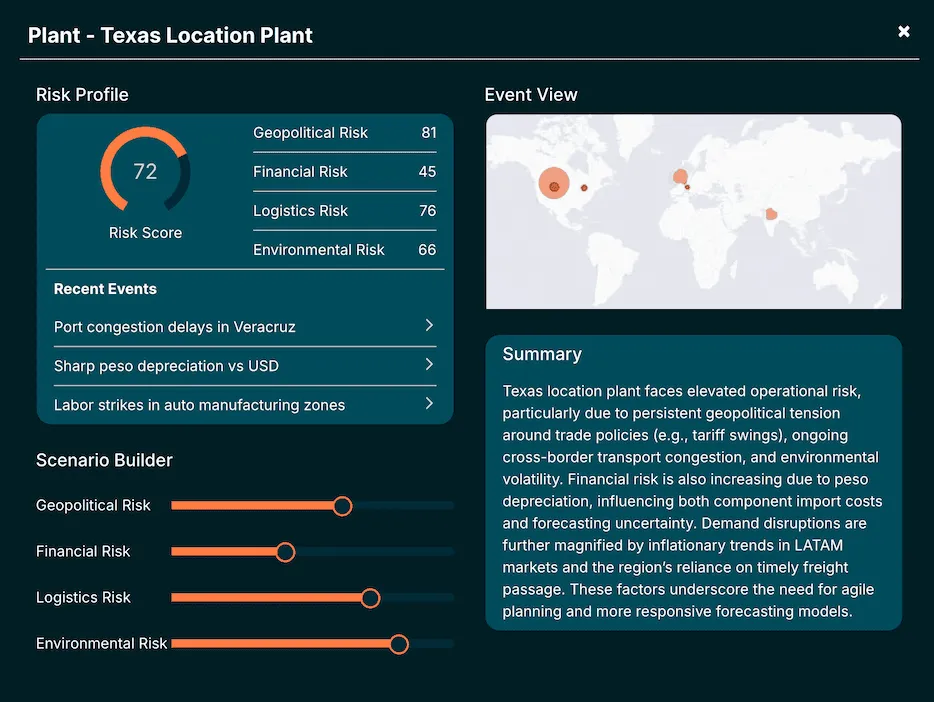
What-If Modeling
Across demand, supply, logistics, and market shifts.
Global Food and Beverage Company
Satellite-Scale Monitoring
Terabytes of climate and trade data track drought and rainfall.
Real-Time Risk Detection
Across cocoa, coffee, and raw materials at global scale.


What kind of supply chain risks does this monitor?
Does this replace our existing ERP or BI tools?
How is this different from a generic analytics dashboard?
How do I get started?
